

Introduction
Your social media reach is up, the website traffic graph looks healthy, and yet the business feels no busier. If that sounds familiar, the problem is usually not the marketing itself. It is the numbers being used to judge it.
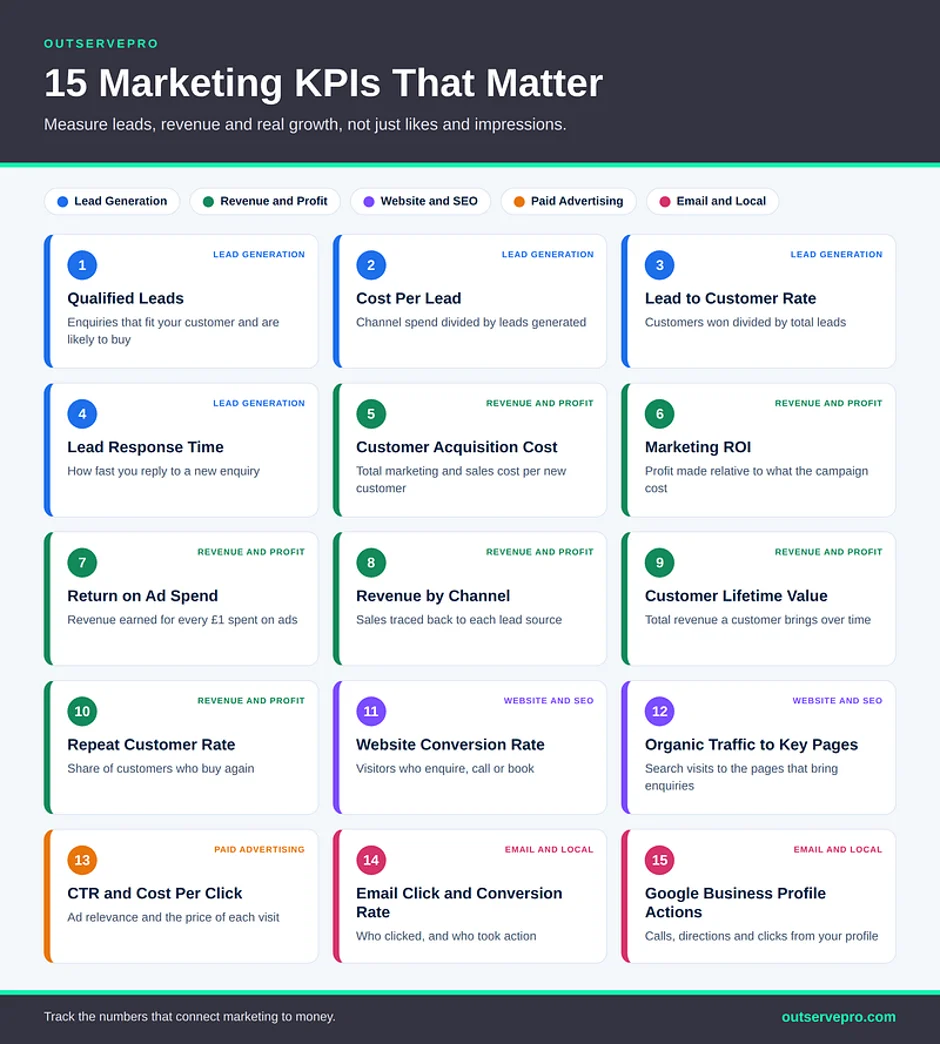
The marketing KPIs that matter for a UK SME are the ones that connect activity to money. They fall into five groups: lead generation, revenue and profit, website and SEO, paid advertising, and email and local visibility. Together they show how many good enquiries you are getting, what each customer really costs, and whether your marketing earns back more than it spends. Likes and impressions can add context, but they are not results.
What surprises most business owners is that some of the most useful KPIs are not the ones they check first, and a few sit slightly outside marketing altogether, yet they decide whether your spend pays off. Here are all 15, with how to calculate each one and when it is worth watching.
Can’t Tell Which Marketing Is Actually Paying Off?
If your reports show plenty of activity but very little about leads and revenue, the reporting is usually the problem. Our digital marketing team builds tracking and KPI reporting around the numbers that actually drive your business.
What Are Marketing KPIs and Why Do They Matter for UK SMEs?
A marketing KPI, or key performance indicator, is a measurable figure that shows whether your marketing is moving the business towards a specific goal, such as more enquiries, a lower cost per customer or higher revenue. A metric is any number you can measure. A KPI is a metric you have chosen because it is tied to a business outcome.
This matters for SMEs because budgets are tight and there is rarely time to chase every dashboard. Without clear KPIs, decisions get made on instinct, the loudest channel gets the credit, and money keeps going into activity that looks busy but never shows up in the bank. Good KPIs make it clear what to keep, what to fix and what to stop.
Vanity Metrics vs Actionable Marketing Metrics
Vanity metrics are numbers that look impressive but say little about whether the business is growing. Impressions, reach, likes, follower counts and total page views are the usual examples. They are not useless, because they show whether people are noticing you, but they do not tell you whether anyone became a customer. Our guide to an organic social media strategy that generates leads shows how to shift social activity towards enquiries.
Actionable marketing metrics are tied directly to leads, sales, cost or revenue. They answer questions you can act on, such as which channel brings in the cheapest customers, or where enquiries are being lost after they arrive.
A simple test is to ask whether the business would necessarily earn more money if this number doubled tomorrow. If the answer is no, it is probably context rather than a KPI.
Lead Generation KPIs: Are You Attracting the Right Enquiries?
1. Qualified Leads
A qualified lead is an enquiry from someone who fits the customers you can serve and is genuinely likely to buy, for example someone in your area, with a realistic budget, asking about a service you offer. A raw enquiry count can be misleading, because time wasters and wrong-fit enquiries inflate it.
Decide what qualified means for your business, then record it for every enquiry. Over time, this shows which channels bring in people worth speaking to and which just bring in noise. A simple way to keep track is covered in how to build a simple lead management system for your SME.
2. Cost Per Lead
Cost per lead is the amount you spend on a channel divided by the number of leads it produced. As an example, £600 spent on a campaign that generated 30 leads gives a cost per lead of £20.
It is most useful for comparing channels and campaigns against each other. A cheap lead is not automatically a good one, so always read it alongside conversion rate. A channel with a higher cost per lead can still be the better investment if those leads turn into customers more often.
3. Lead to Customer Conversion Rate
This is the percentage of leads that become paying customers. Divide the number of customers by the number of leads and multiply by 100. If 8 out of 40 leads become customers, the conversion rate is 20%.
When this number is low, the issue is often not the marketing but what happens after the enquiry, such as slow replies, unclear quotes or no follow-up. If that sounds familiar, it is worth reading about why leads aren’t turning into customers and how lead nurturing keeps interested people engaged until they are ready.
4. Lead Response Time
Lead response time is how long it takes you to reply to a new enquiry. It sits slightly outside traditional marketing, but it has a direct effect on whether your marketing spend pays off, because a lead you paid for is worth very little if it goes cold waiting.
We have found that enquiries answered quickly tend to progress further than those left waiting. Track the time between an enquiry arriving and your first reply, and aim to make it consistently short, especially for phone calls and messages that come in outside normal hours. If calls regularly go unanswered, see why missed calls are costing you customers.
Revenue and Profit KPIs: Is Your Marketing Paying for Itself?
5. Customer Acquisition Cost
Customer acquisition cost, often shortened to CAC, is the total cost of winning a new customer. Divide your total marketing and sales spend over a period by the number of new customers won in that period.
Include everything: ad spend, software, agency or freelancer fees, content production and the time spent managing campaigns. Leaving out labour and tools is the most common reason acquisition cost looks lower than it really is. The figure only becomes meaningful when you compare it with what a customer is worth over time.
6. Marketing ROI
Marketing ROI measures how much profit a campaign produced relative to what it cost. Take revenue minus cost, divide by cost, then multiply by 100. A campaign that brought in £5,000 on a total cost of £2,000 has an ROI of 150%.
It is the clearest single number for deciding whether to keep, cut or scale a channel, but only if the cost and revenue figures are honest. Our guide to tracking marketing ROI explains what to count and how to attribute revenue properly.
7. Return on Ad Spend
Return on ad spend, or ROAS, is the revenue generated for every pound spent on ads. Divide the revenue from the ads by the ad spend. A ROAS of 4 means £4 in revenue for every £1 spent.
ROAS is quick to read, which makes it popular for paid campaigns, but it ignores other costs such as tools, labour and the cost of delivering the product or service. A strong ROAS does not always mean a profitable campaign, so use it alongside ROI rather than instead of it.
8. Revenue by Channel
Revenue by channel shows how much money came from each source, such as Google Ads, SEO, referrals, social media or email. It answers the question most business owners really want answered: where do my customers actually come from?
This only works if you record the source of every lead and carry it through to the sale. Be careful about giving all the credit to the last channel a customer touched, since earlier channels often did the work of building awareness. Looking at revenue by channel over several months gives a fairer picture than any single week.
Not Sure Where Your Revenue Is Really Coming From?
Revenue by channel only works when every lead is recorded and followed through to the sale. Our CRM and sales support team can help you set up a simple system that tracks each enquiry from first contact to paying customer.
9. Customer Lifetime Value
Customer lifetime value is the total revenue a customer is likely to bring over the whole time they buy from you. A simple way to estimate it is average spend per purchase, multiplied by the number of purchases per year, multiplied by the number of years they typically stay.
It changes how you read every other number. If a customer is worth far more than their first purchase, you can justify spending more to win them, and a campaign with a modest ROI may still be a good one.
10. Repeat Customer Rate
Repeat customer rate is the share of your customers who buy from you more than once. Divide the number of returning customers by your total customers over a period.
Winning a new customer is usually more expensive than keeping an existing one, so this KPI often points to the cheapest growth available. If it is low, look at how to turn a one-time customer into a repeat customer before increasing your acquisition budget.
Website and SEO KPIs: Is Your Site Turning Visitors Into Leads?
11. Website Conversion Rate
Website conversion rate is the percentage of visitors who take a valuable action, such as submitting a form, calling or booking. Divide the number of conversions by the number of visitors and multiply by 100.
Measure it for the whole site and for your most important pages separately. If traffic is healthy but conversions are low, the issue is usually the page itself, whether that is unclear messaging, a weak call to action, a slow mobile experience or a contact form that asks for too much.
12. Organic Traffic to Key Pages
Total organic traffic is a vanity number if the visitors never reach the pages that bring in business. A more useful KPI is the number of visits from search to your key pages, such as service pages, location pages and the articles that lead to enquiries, together with how many enquiries those pages produce.
SEO builds over months rather than weeks, so judge this KPI over a longer period. The reasoning behind that is explained in SEO vs Google Ads: which should you invest in first.
Paid Advertising KPIs: Are Your Ads Bringing Buyers or Just Clicks?
13. Click-Through Rate and Cost Per Click
Click-through rate is the percentage of people who saw your ad and clicked it. Divide clicks by impressions and multiply by 100. Cost per click is what you pay on average for each click, calculated by dividing ad spend by the number of clicks.
Together they show how relevant your ads are and how much traffic costs. Neither tells you whether the traffic is any good, so always check them against conversion rate. If clicks are coming in but enquiries are not, read about why Google Ads are getting clicks but no leads, and see how high-converting ad copy can improve the quality of those clicks.
Email and Local KPIs: Are You Staying Visible Where It Counts?
14. Email Click Rate and Conversion Rate
Click rate shows what share of recipients clicked a link in your email, which reflects how relevant and compelling the content was. Conversion rate shows how many went on to take the action you wanted, such as booking or buying.
Open rates are worth a glance, but they can be less reliable as a measure on their own, so click and conversion rates give a clearer picture. Judge each email on the one action it was designed to prompt. If you are just getting started, our step-by-step guide to email marketing for UK SMEs covers the basics.
15. Google Business Profile Actions
For local businesses, many customers call, ask for directions or message straight from the Google Business Profile without ever visiting the website. These actions are easy to miss because they do not show up in website analytics.
Track the calls, direction requests, website clicks and messages your profile generates each month. For businesses that serve a local area, this can be one of the most valuable KPIs on the list, and it connects closely to whether your Google Business Profile is costing you local customers.
How Many Marketing KPIs Should a Small Business Track?
Most small businesses are better off tracking four to six KPIs well than fifteen badly. Start with your main goal, then choose the numbers that show whether you are getting closer to it. A few examples of sensible starting points:
- Local service businesses: qualified leads, lead response time, Google Business Profile actions, cost per lead and lead to customer conversion rate.
- B2B and professional services: cost per lead, lead to customer conversion rate, customer acquisition cost, revenue by channel and customer lifetime value.
- Businesses running paid ads: return on ad spend, marketing ROI, click-through rate, cost per click and website conversion rate.
- Businesses focused on retention: repeat customer rate, customer lifetime value, and email click and conversion rate.
As the business grows and your tracking improves, add more. The aim is a short list you actually review, not a long one that gets ignored.
How to Track Marketing KPIs Without Complicated Tools
Accurate tracking does not need expensive software. A practical setup for most UK SMEs includes:
- Lead source recorded on every enquiry, whether it comes from a form, a call or a message, so revenue can be traced back to where it started.
- Conversion tracking set up directly in Google Ads and Meta Ads, so each platform reports leads and sales properly.
- UTM parameters on links used in ads, emails and social posts, so your analytics can show where visits come from.
- A simple spreadsheet or basic CRM that links each lead to its source, its outcome and its value.
- One monthly summary that shows your chosen KPIs side by side, so patterns are easy to spot.
How Often Should You Review Marketing KPIs?
For most SMEs, a monthly review is the right rhythm. It is frequent enough to catch problems and spot patterns, and spaced out enough that small daily swings do not cause overreaction.
Active paid campaigns deserve a quicker check, often weekly, because spend can be wasted fast. Slower KPIs such as organic traffic, customer lifetime value and repeat customer rate are better judged quarterly.
Compare results against your own past performance rather than a generic industry figure, since your margins, customers and services are specific to you.
Common Marketing KPI Mistakes UK SMEs Make
A few patterns show up repeatedly when marketing reporting does not help:
- Tracking too many numbers, which makes it hard to see what matters.
- Leaning on vanity metrics because they are easy to find and usually look good.
- Not recording lead source, which makes revenue by channel impossible to calculate.
- Leaving out labour and tool costs, which makes campaigns look more profitable than they are.
- Judging slower channels too early, particularly SEO and content.
- Giving all the credit to the last click, ignoring the channels that built awareness earlier.
- Having no baseline, so there is nothing to compare new results against.
- Reporting without acting, when the point of a KPI is to change a decision.
The Bottom Line
The marketing KPIs that matter are the ones that tell you whether marketing is bringing in customers at a cost the business can afford. Likes and impressions have a place as context, but leads, conversion, cost, revenue and retention are what decide whether marketing is working.
Pick a short list that fits your goals, record where every lead comes from, review the numbers on a regular schedule and use them to change what you do next. That is what separates reporting that looks good from reporting that helps the business grow.
How OutservePro Helps UK SMEs Measure Marketing That Works
At OutservePro, we build clear measurement into the digital marketing we manage, including Google Ads, SEO and lead generation. That means setting up proper tracking from the start, choosing KPIs that fit your goals and reporting on leads, cost and revenue rather than just clicks and impressions.
If you are not sure which numbers to trust, or your current reports do not tell you what is working, it is worth getting a clear picture before spending more.
Get a Free Marketing Performance Review
Frequently Asked Questions
What are the most important marketing KPIs for a small business?
The most useful ones link marketing to money: qualified leads, cost per lead, lead to customer conversion rate, customer acquisition cost, marketing ROI and revenue by channel. Which of these matter most depends on your goals and how you win customers.
What is the difference between a metric and a KPI?
A metric is any number you can measure. A KPI is a metric you have chosen because it is directly tied to a business goal, such as more qualified enquiries or a lower cost per customer.
What are vanity metrics in marketing?
Vanity metrics are numbers that look impressive but do not show whether the business is growing, such as impressions, reach, likes and follower counts. They can give useful context, but they should not be the main measure of success.
How many marketing KPIs should I track?
Four to six is a sensible starting point for most small businesses. A short list you review regularly is more useful than a long one that nobody has time to read.
What is a good cost per lead?
There is no single figure that applies to every business. A good cost per lead depends on your margins, your average customer value and how many leads turn into customers, so compare it against your own results over time.
How do I measure marketing performance without expensive software?
Record the source of every lead, set up conversion tracking in your ad platforms, use UTM links, and keep a simple spreadsheet or basic CRM linking each lead to its outcome and value. Review the results monthly.
How often should I review my marketing KPIs?
Monthly works well for most businesses. Check active paid campaigns more often, and review slower KPIs such as organic traffic and customer lifetime value every quarter.